- Sales
- Marketing
- Market Research
- eCommerce Managers
- Data Science
- Product
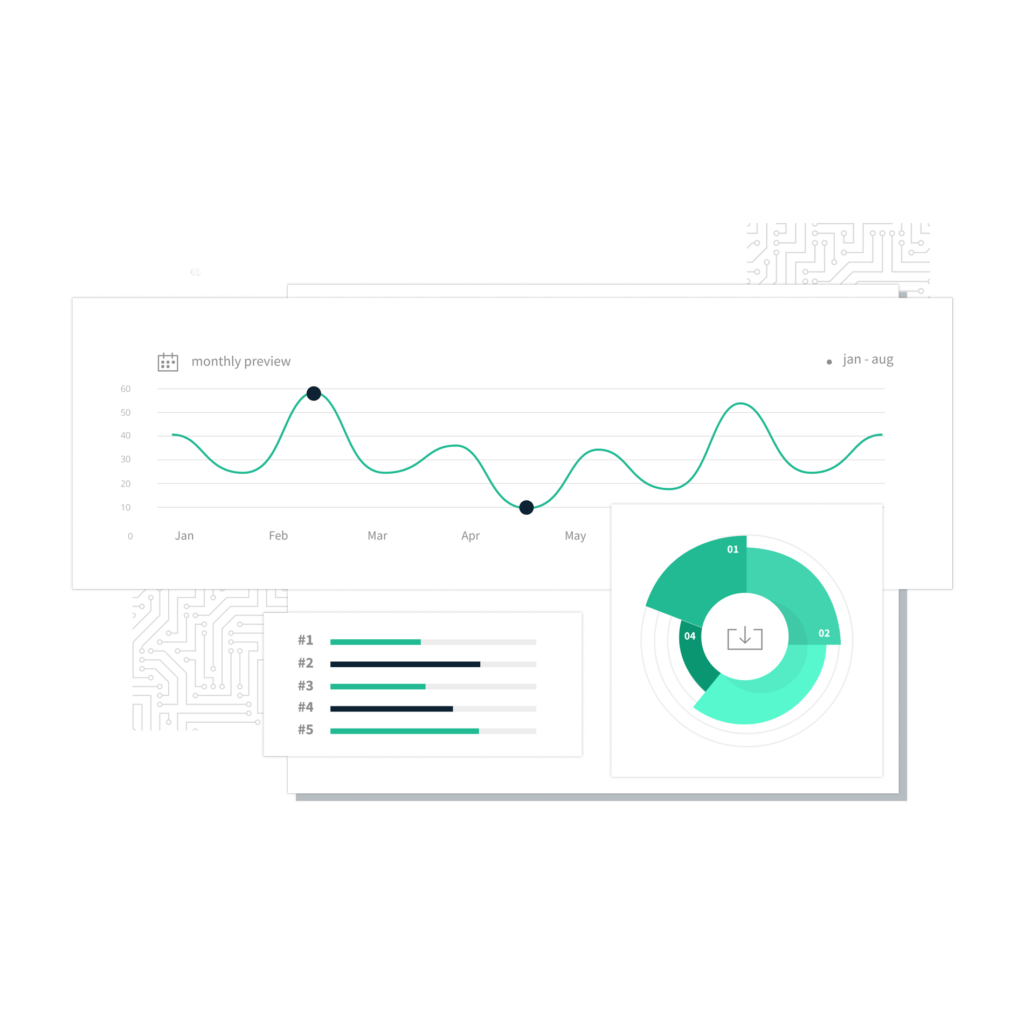
Create dashboards, charts, and reports with the look you want. Include Netrivals data in your own Business Intelligence dashboards and customize it any way you like. You can use the type of chart that best suits your needs and ensure that the data display is not affected by a limitation in the type of charts available.
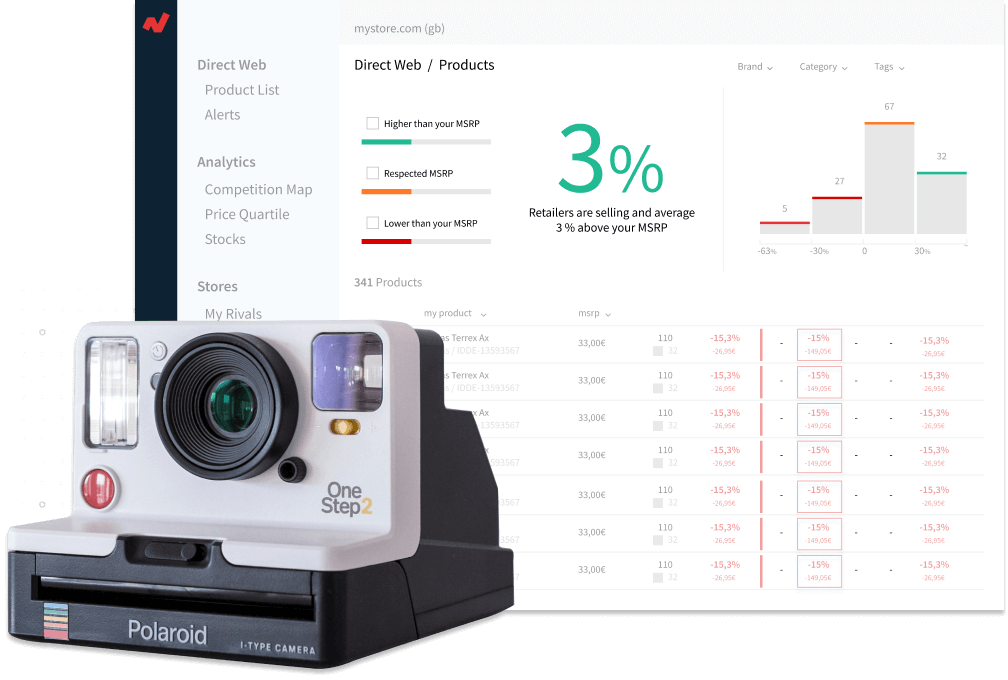
Netrivals allows you to combine the data extracted by the platform with data from other areas or departments of your business. This makes it possible for your team to access higher quality data that will help improve their decision making, thanks to an optimization in the visualization of the KPIs of each department.
Frequency in price changes
History of prices
By increasing the use of your Business Intelligence tool, you reduce the cost per insight and help your company become more data driven. Netrivals makes it easy for you: build custom dashboards and extend the use of your Business Intelligence tool to other departments that can benefit from the great value of the KPIs provided.
All data is accessible from a single location and information is represented by the graphics that work best for your team. It has never been so simple to display and share data with your team members and even other departments.
